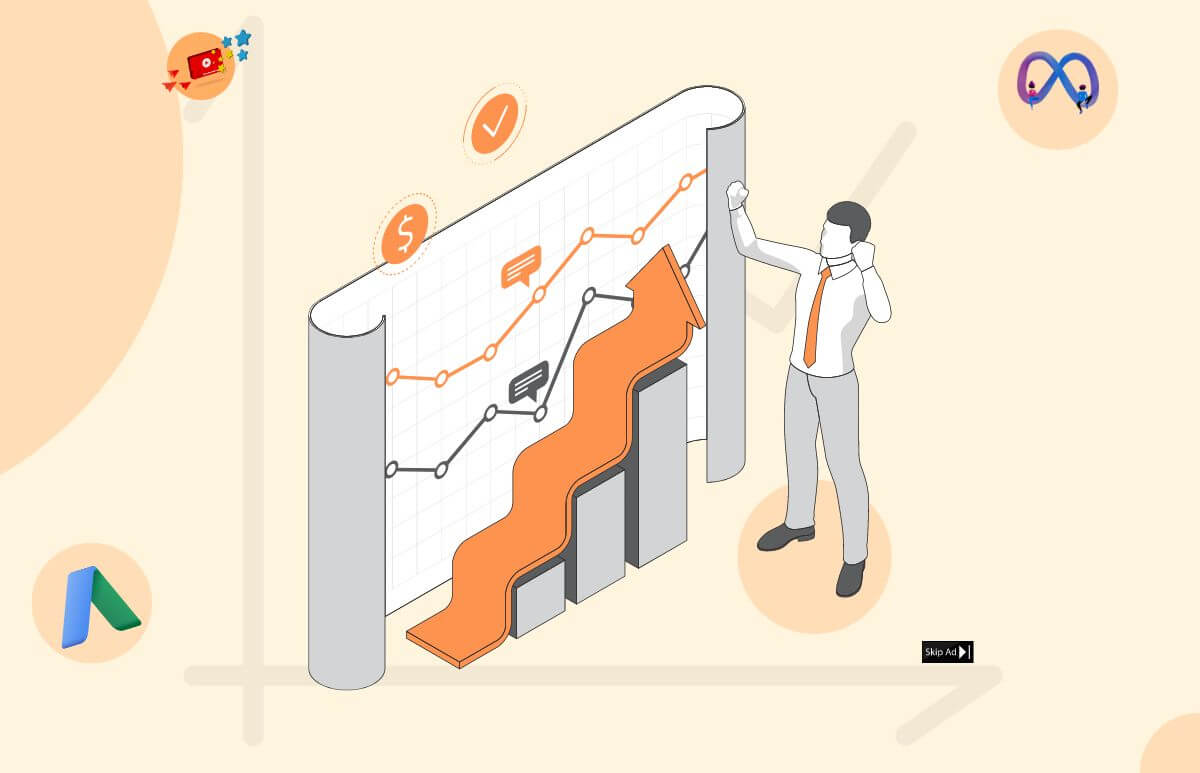
“It was calculated that the digital advertising spending worldwide amounted to 522.5 billion U.S. dollars in 2021. The source projected that by 2026, the spending would reach 836 billion dollars.”
According to Statista
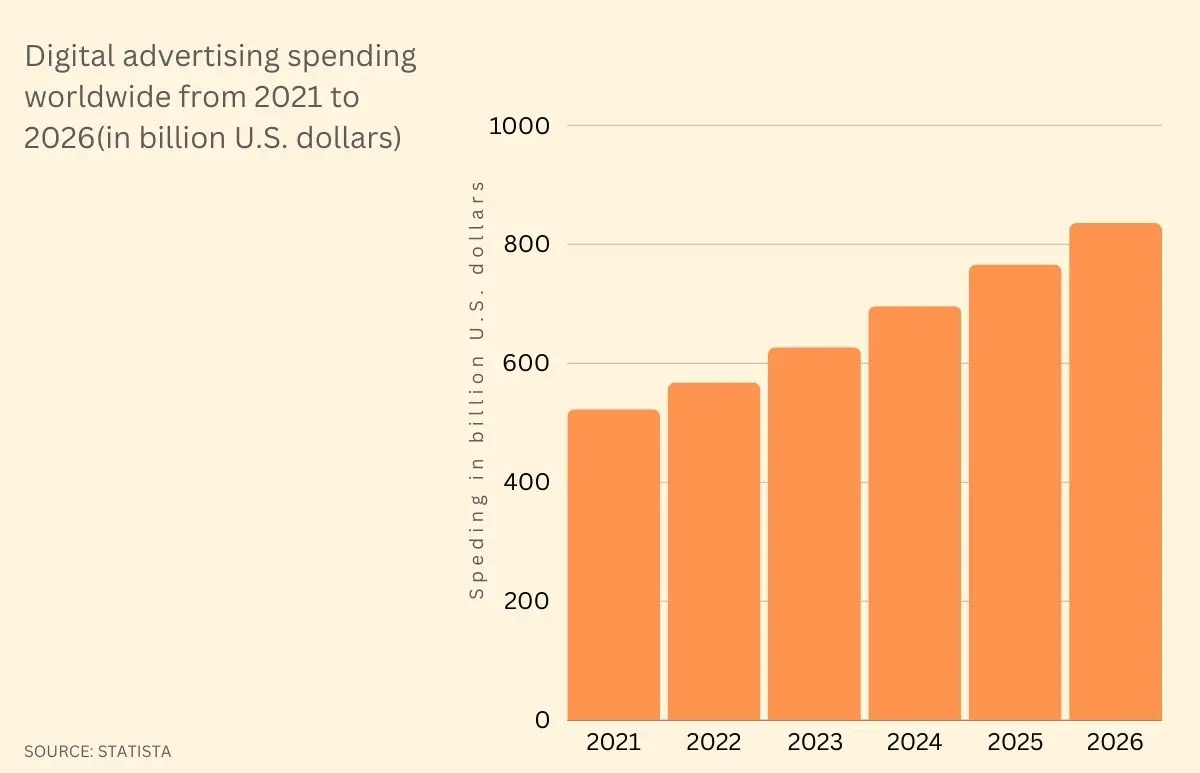
Performance Marketing is a paid advertising strategy (in Digital Marketing) where an advertiser spends money for a desired action such as a Click, or a conversion.
In this method, the advertising budget is only spent when the target audience takes an action that you desire. We will learn more about this advertising strategy below in the article.
This advertising method is rapidly growing across industries and is getting the likes for its exceptional ROAS (Return on Advertising Spend). Some of the advertising platforms used under Performance Marketing are Google Ads and Meta Ads.
Digital Marketing modules have grown manifold in the last decade. Its use cases are appraised through industries where more and more brands are trying their hands into Digital Marketing.
Performance Marketing in particular is one of the fastest adopted Digital Marketing modules because of the several benefits it brings with itself.
Cost-Effectiveness and Efficiency

Performance Marketing can bring in exceptional results if done the right way! It is more cost effective, efficient and better measurable when compared with traditional advertising forms. For instance, you have a shoe shop in a city and you advertise your shop in a newspaper.
The entire city will see your ad but you’ll have no clue on how many people saw your ad and how many showed interest in it. You’ll also have to pay a price to get your ad published in the newspaper without seeking anything significant from it.
Meanwhile, if you use performance marketing, you will pay only when someone clicks or views your ad (as per the conversion set by you). Performance Marketing allows you to leverage flexible budgeting, excellent audience targeting, and measurable results.
Such powerful features have made Performance marketing a result-driven strategy and is helping businesses achieve marketing objectives.
Targeted Reach and Audience Segmentation

Another great reason why Performance Marketing is a strategy of choice for brands is because of its advanced targeting, exceptional reach and audience segmentation. Meta platforms such as Facebook and Instagram have millions of users who surf content that excites them and are of their interest. Platforms like these take a note of these behaviours and are capitalised by the advertisers.
When running Meta Platform ads, you can do specific audience targeting and drive engagement and conversions. You can show ads to targeted audiences based on their behaviour, demographics and interests.
On the contrary, in Google ads, you can show ads to people based on the keywords (search queries) on Google. You can set a specific location to show your ads and it will be seen in that area only.
When you show targeted ads to people that are of their interest, it is likely to resonate with them and they are more likely to engage with it. Thus, increasing the chances of their conversion.
Measurable Results and ROI
Performance Marketing gives you the ability to measure your ad campaigns and optimise them for better results. In Google Ads, you can see what keywords are working well, what is the average CPC, number of impressions etc. This enables you to track your spending and offer opportunities to optimise your ad campaigns.
Both Meta and Google ads provide real-time analysis of ad delivery, engagement, impressions and views.
Flexibility and Scalability

Performance Marketing gives you flexibility to scale your business as by increasing the budget, you can target wider areas, more audience and increase your reach. This is one of the major perks of Performance Marketing that you can advertise as per your convenience.
Similarly, you can run objective specific campaigns such as for Leads, Conversions, YouTube video views and more. Such dynamism keeps businesses agile and responsive to changing trends thus, fostering sustainable growth.
Enhanced Customer Engagement and Retention

Customer engagement is one of the pivotal events in sustainable business growth and building good relations with customers. Performance Marketing allows you to run personalised ad campaigns that are designed to suit the interests of your target audience.
Remarketing Ad campaigns works best when it comes to showing personalised ads to your audience.
Competitive Advantage

Performance Marketers can do competitor analysis and based on that they can optimize their campaigns to outperform their rivals. They can optimize for better ad copies, better targeting, personalised messaging, data-driven insights and more.
Brief history and evolution of Google and Meta Ads.

Google Ads and Meta Platform Ads are the two prominent advertising modules with the highest penetration. As per Agency Analytics, Google Ads have more reach when compared to that of Meta Ads keeping in mind that Google has more daily users than Facebook.
However, the evolution of both started in the 2000s where Google launched Google Adwords in 2000 and Facebook launched Facebook Ads in 2007.
Both Google and Facebook realised the power of the internet way ahead of everyone and the results? These two tech giants today control the online advertising space like none other.
Both of them have a different functioning like Google Ads are inbound ads where a user comes on the Search bar to look for your product/service whereas in Meta Ads are outbound where the advertiser reaches out to their target audience on their feed based on their interests, geography and demographics.
What to measure? Key Performance Indicators (KPIs) of Performance Marketing
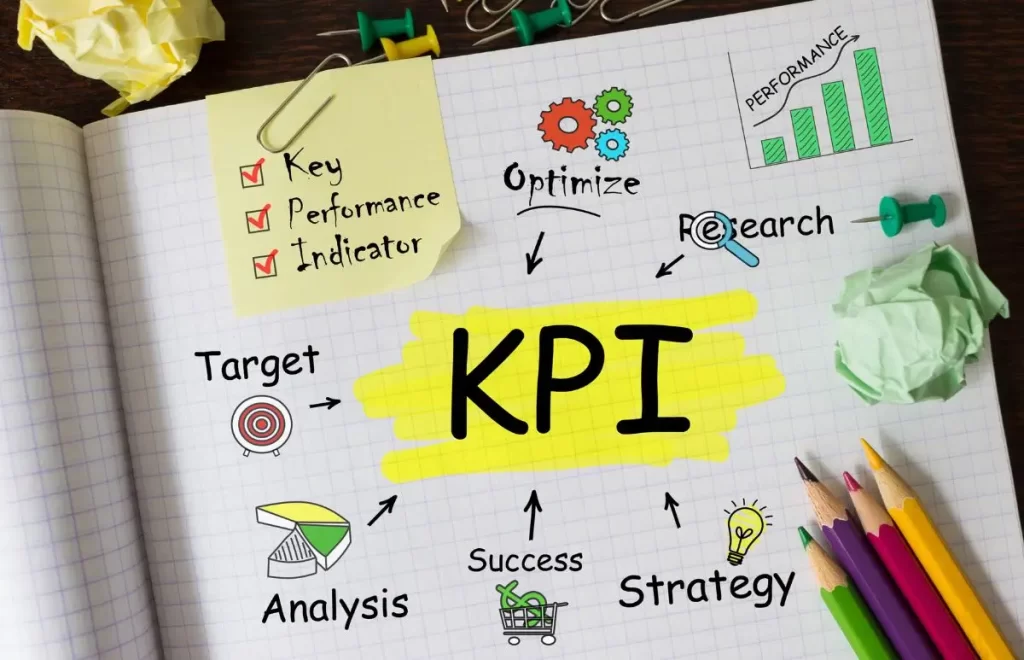
In this internet era, data is oil! When you run Performance Marketing campaigns and your Ads dashboard shows that for every 500 rupees invested, you have made 3000 as revenue, you’ll be quite satisfied as your Return on Investment (ROI) will be 500%.
This ‘ROI’ is one Key Performance Indicator (KPI) in Performance Marketing. Such KPIs are so powerful that they enable you to monitor, optimise, and improvise your advertising campaigns.
Key Performance Indicators in Digital Marketing and not just in Performance Marketing gives us an edge over conventional offline advertising strategies.
Let us understand a few more KPIs of Performance Marketing –
Return on Investment (ROI):
Return on Investment is a major KPI that measures how profitable the Performance campaign is. It measures the total revenue generated from the amount spent in advertising.
Calculate your Return on Investment: (Revenue – Cost) / Cost * 100%.
Imagine you run a travel agency. Let’s say you invest ₹10,000 in online advertisements to promote a Same Day Taj Mahal Tour. You set a special price of ₹20,000 per person for this package.
Revenue: 2 people book the Same Day Taj Mahal Tour through your ads, generating a total revenue of
2 people * ₹20,000/person = ₹40,000.
Cost: You spent ₹10,000 on the online advertisements.
Gross Profit: Using the formula (Revenue – Cost) / Cost, we get (₹40,000 – ₹10,000) / ₹10,000 = 3%.
This means for every rupee spent on advertising, you earned an initial profit of 3%.
However, this doesn’t consider the full picture:
Extra Costs: There are other expenses involved in this trip, like bus fares, hotel bookings, and a guide. Let’s assume these extra costs add up to ₹5,000 per person, totalling ₹5,000/person * 2 people = ₹10,000.
Beyond Money: These ads might also be attracting people to your website who aren’t booking the Same Day Taj Mahal Tour yet, but might consider your agency for future trips.
Taking everything into account:
If the total cost of the trip (including ads and other expenses) is ₹20,000 (₹10,000 ads + ₹10,000 other costs) and your revenue is ₹40,000, you’ve made a profit.
But to understand the complete picture, you’d need to factor in all your travel agency’s expenses and analyze long-term benefits like brand awareness.
Remember, this is a simplified example. In reality, you’d track various metrics like ad clicks, website visits, and conversions (bookings) to get a more accurate understanding of your campaign’s effectiveness.
Cost per Acquisition (CPA):

Acquisition costs are very important for all businesses. Cost per acquisition tells you how much you have spent to acquire one customer (on average).
Calculate your Cost of Acquisition: Cost of Advertising Spent / Number of acquisitions.
I’m continuing the above travel agency example where you were running an ad for a same-day Agra tour. As we remember, your ad cost was ₹10,000, and 2 people booked the Same Day Taj Mahal Tour through your ads.
Using the CPA formula:
CPA = ₹10,000 (Ad Cost) / 2 people (Acquisitions) = ₹5,000 per person.
This means that, in this instance, acquiring each customer (booking a trip for one person) through those ads costs ₹5,000.
CPA is a useful metric because:
Comparing advertising costs: It lets you compare the effectiveness of different campaigns. As an example, if another ad campaign cost 15,000 but brought in 5 bookings, your CPA would be lower (3,000), indicating higher performance.
Sets Budgets: Understanding your CPA will help you set budgets for future campaigns. A good way to plan your ad spend is to determine what level of investment you are comfortable with.
Here’s the catch:
Just as the ROI formula only considers advertising costs, CPA does not consider the whole trip cost. A brand awareness campaign also doesn’t take into account non-monetary benefits.
So, while CPA is a valuable metric, it should be used along with other factors to understand the complete picture of your advertising efforts.
Click-Through Rate (CTR):
CTR represents the ratio of users who clicked on your ad from the number of times the ad was seen. Higher the CTR, higher the attractiveness and creativeness of your Ad.
Calculate your Click through rate: (Number of Clicks / Number of Impressions) * 100%
Let’s consider your travel agency example and see how CTR applies:
Number of Clicks: Imagine your ads were displayed 10,000 times (impressions), and 100 people clicked on them to visit your website.
Number of Impressions: As mentioned earlier, the ads were displayed 10,000 times.
Using the CTR formula:
CTR = 100 clicks / 10,000 impressions = 0.01 = 1%
In this case, your CTR is 1%. This means that out of every 100 people who saw your ad, only 1 person clicked on it.
A good CTR indicates:
Targeted Audience: Your ad might be reaching the right people who are interested in a same day Agra tour.
Compelling Ad: The ad itself might be eye-catching and informative, prompting people to click and learn more.
However, a low CTR doesn’t necessarily mean your campaign failed:
Brand Awareness: Even if people didn’t click right away, they might still be aware of your travel agency and consider you for future trips.
Ad Placement: Your ads were displayed on websites not frequented by your target audience (people looking for travel deals).
Here’s the key takeaway:
CTR is a good metric to understand how well your ad grabs attention and entices clicks. But to fully assess your campaign’s effectiveness, you should consider it alongside other metrics like CPA (cost per acquisition) and even monitor how many website visitors convert into actual bookings.
Conversion Rate:
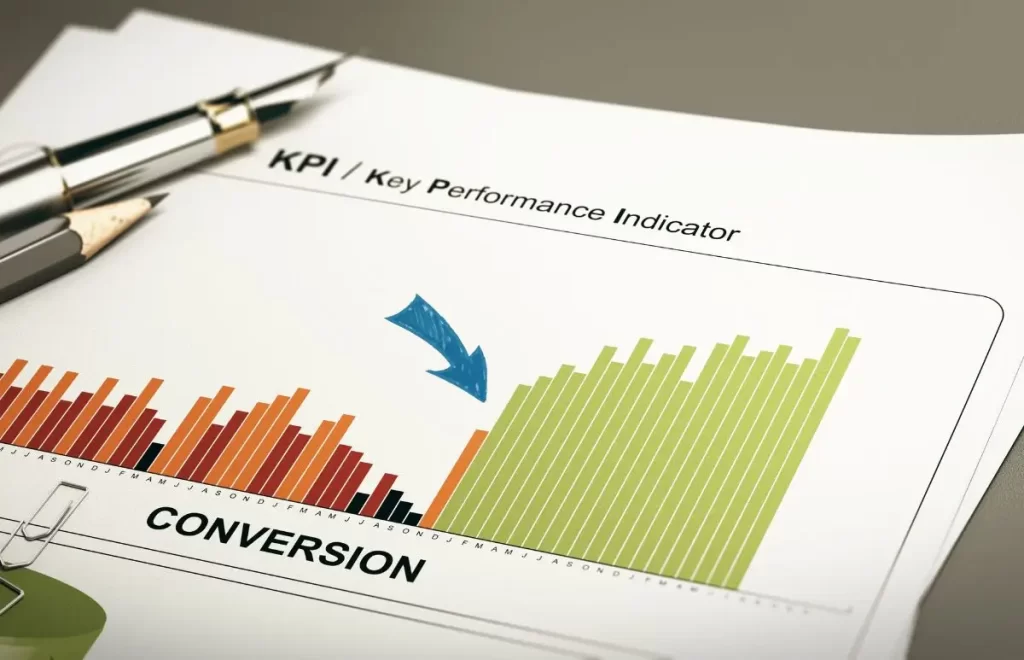
Conversion rate is percentage of desired taken by the user such as signing up, purchasing a product or by clicking on an ad.
Calculate your Conversion Rate: (Number of Conversions / Number of Clicks) * 100%
Let’s take the travel agency example again to see how the Conversion Rate applies:
Number of Conversions: We saw that 100 people clicked on your ads, but only 2 of them converted by booking a same-day Agra tour.
Number of Clicks: As mentioned earlier, there were 100 clicks on your ad.
Using the Conversion Rate formula:
Conversion Rate = (2 conversions / 100 clicks) * 100% = 0.02 * 100% = 2%
In this case, your Conversion Rate is 2%. This means that out of every 100 people who clicked on your ad, only 2 people converted into paying customers for the same-day Agra tour.
A high Conversion Rate generally indicates:
Effective Ad: Your ad successfully convinces people to click through and then take the desired action (booking the trip).
Targeted Audience: Your ad is reaching people who are genuinely interested in what you’re offering (same-day Agra tour).
Please take note of the following limitations:
Limited Scope: Conversion Rate only focuses on people who clicked on the ad. It doesn’t take into account people who saw the ad but didn’t click, some of whom might still be interested.
So, while Conversion Rate is a valuable metric, it should be used along with other factors like CTR (click-through rate) to understand the complete effectiveness of your advertising campaign.
Cost per Click (CPC):
CPC is the average cost that you as advertiser paid for every click. It is the most important KPI to keep in tap otherwise you can over budget your spending. A good CPC indicates efficiency of bidding strategy.
Calculate your CPC: Total Costs / Number of Clicks
Continuing with your travel agency example, let’s calculate the CPC:
Total Costs: You spent ₹10,000 on online advertisements for the trip.
Number of Clicks: Recall that 100 people clicked on your ads.
Using the CPC formula:
CPC = ₹10,000 (Total Cost) / 100 clicks = ₹100 per click
In this example, your CPC is ₹100 per click. This means that for every time someone clicked on your ad, you were charged ₹100.
A lower CPC is generally desirable because it indicates:
Efficiency: You’re getting more clicks for your advertising budget.
Targeting: Your ads reach a more relevant audience who is likely to click.
Here’s a point to remember:
CPC (cost per click) does not consider the entire trip cost, just as CPA (cost per acquisition) does not. Additionally, it ignores non-monetary benefits such as brand awareness.
For a complete picture of your campaign’s performance, combine CPC with other metrics such as conversion rate and CTR.
Return on Ad Spend (ROAS):

Return on Ad Spend represents the average revenue generated from the advertising spent.
Calculate your Return on Ad Spend: Total Revenue / Advertising Spend
Let’s revisit the travel agency example and see how ROAS applies:
Total Revenue: Imagine you made a total of ₹40,000 in revenue from the booking made through your ads.
Advertising Spend: As mentioned earlier, you spent ₹10,000 on online advertisements for the trip.
Using the ROAS formula:
ROAS = ₹40,000 (Total Revenue) / ₹10,000 (Advertising Spend) = 4
In this case, your ROAS is 4. This means that for every rupee you spent on advertising, you generated ₹4 in revenue. Generally, a higher ROAS is desirable as it indicates a good return on your advertising investment.
Here are some additional factors to consider when evaluating ROAS:
Cost of goods sold: The cost of the product or service you’re selling will impact your profit margin and, therefore, your ROAS.
Customer lifetime value: If you can acquire customers who will make repeat purchases, your ROAS will likely be higher over time.
By considering ROAS alongside other metrics like CTR (click-through rate) and conversion rate, you can get a well-rounded picture of your advertising performance and make adjustments as needed.
Engagement Rate:

When you advertise, with Engagement Rate, you can see and monitor how your users are interacting with your content. The actions which you can measure here are likes, comments, shares, video views and more.

